
How to Analyze Qualitative Data: A Step-by-Step Guide?

In this blog post, I briefly explain- how to analyze qualitative data with a step by step guide and a practical example taken from the study of Noble & Smith (2014). Besides, this post covers the following topics:
- What is qualitative data analysis?
- How to analyze qualitative data?
- How do qualitative researchers ensure data analysis procedures are transparent and robust?
- What are the key points to keep in mind while analyzing qualitative data?
These topics are explained here in detail.
What is qualitative data analysis?
Qualitative data analysis (QDA) is a systematic, iterative and interpretive process used to analyze non-numerical data, typically collected through methods such as interviews, focus groups, observations, or open-ended surveys. This type of analysis aims to uncover and understand the underlying meaning, patterns, and themes within the data, providing rich insights into the social, cultural, psychological, or experiential aspects of a phenomenon.
QDA is widely employed in various disciplines, including sociology, psychology, anthropology, education, and healthcare, among others. Its flexibility and ability to capture nuanced aspects of human experiences make it a valuable method for exploring complex phenomena in depth.
It is a fundamental step in qualitative research to explore and understand complex phenomena, behaviors, and human experiences. It involves coding the data, identifying patterns, and developing themes to uncover the underlying meanings and insights within the information collected. Researchers immerse themselves in the data, continuously comparing and refining codes, and may apply theoretical frameworks to guide their interpretations.
The process prioritizes context, participant perspectives, and iterative refinement, aiming to provide a rich, nuanced understanding of the studied phenomenon. The final outcomes contribute to a comprehensive narrative presented in research reports, emphasizing the depth and complexity of human experiences and social phenomena essential to the creativity of the analysis, development of ideas, clarifying meaning and the reworking of concepts as new insights ‘emerge’ or are identified in the data.
How to analyze qualitative data?
Analyzing qualitative data is a stimulating activity but it used to be daunting at times. Here I explain the qualitative data analysis for you in four simple steps:
Step 1: Immerse yourself in the data
Before you start diving deep, take some time to simply soak in the data. This is like getting to know a new place before exploring it in detail. Here’s how you can do this:
- Read and re-read your data: Whether it’s interview transcripts, observation notes, or open-ended survey responses, spend time familiarizing yourself with the raw material. Pay attention to emotions, nuances, recurring themes and patterns.
- Organize your data: Group similar data points together, highlight key quotes, and create summaries to get a bird’s-eye view of your findings. Tools like spreadsheets or qualitative data analysis software can be helpful here.
Step 2: Ask questions and develop codes
Now that you are comfortable with the data, it’s time to start asking questions. What are the main themes emerging from the raw data? What are the participants’ experiences telling you? To answer these questions, you’ll need to develop a coding system.
- Break down your data into smaller units: This could be individual sentences, paragraphs, or even specific words. Each unit will become your unit of analysis.
- Assign codes to each unit: These codes represent key concepts or ideas that you find in the data. For example, you might code a quote about feeling overwhelmed as “work stress” or “burnout.”
- Refine your codes as you move forward: As you analyze more data, you may need to adjust your codes or create new ones. The goal is to have a system that captures the richness and complexity of your data. This is an iterative process.
- Table- 1 contains an extract of data taken from interview with the respondents. Here, the first stage of data analysis reflect the process of initial coding, whereby each line of the data is considered to identify keywords or phrases; these are known as in-vivo codes (highlighted in red).
Table: 1- Data extract containing units of data and line-by-line coding
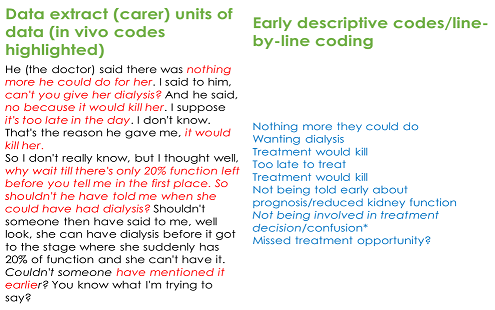
(Noble & Smith, 2014)
Step 3: Identify patterns and themes
Once you have coded your data, it’s time to step back and look for the bigger picture. What are the patterns and relationships emerging from your codes? How do they connect to your research questions? Find a plausible answer to it.
- Look for recurring codes: Which codes appear most frequently? What do they tell you about the overall sentiment or experience of your participants?
- Group related codes into categories, subthemes and themes: Themes are broader categories that capture the essence of several codes. For example, several codes about feeling overwhelmed, frustrated, and unsupported might all be grouped under the category of “job dissatisfaction.” Then group them into sub-themes and then overarching themes.
- Explore the relationships between themes: How do different themes connect to each other? Are there any surprising or unexpected relationships?
- Table 2 provides an example of the early development of codes and categories and how these link to form broad initial themes.
Tab:2- Development of initial themes from descriptive codes
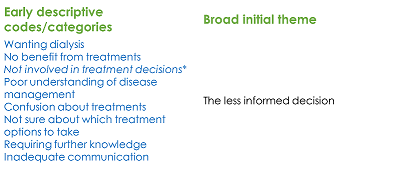
(Noble & Smith, 2014)
- Refining of the themes: Here the subthemes are refined ensuring they accurately represent the data.
- Checking of each emerging theme: It is done so that the emerging themes tell a coherent and meaningful story about the data.
- Considering relationships of themes: Relationship between sub-themes and main themes and their relevance to each other is vitally important which are thoughtfully considered here.
- Table- 3 presents an example of further category development leading to final themes which link to an overarching concept.
Tab:3- Development of final themes and overarching concept
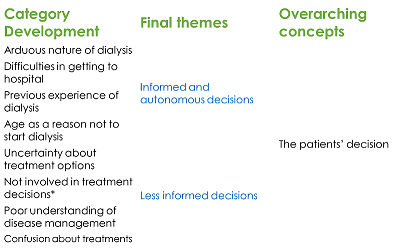
(Noble & Smith, 2014)
Step 4: Make meaning of your findings
The final step is to interpret your findings and draw conclusions from your analysis. What do your results tell you about your research question? How do they contribute to the existing knowledge in your field?
- Compare your findings to your research questions: Did you answer the questions you set out to answer? If not, what new questions emerged from your analysis?
- Consider the limitations of your study: No research is perfect, so acknowledge the limitations of your study and how they might have affected your results.
- Share your findings with the outside world: Write a report, present your findings at a conference, or publish your research in a journal.
Remember, analyzing qualitative data is an iterative process as mentioned earlier. You need to go back and forth between steps as you gain new insights and refine your understanding of the data. But by following these steps and staying open to the possibilities, you can turn your qualitative data into rich and meaningful findings.
How do qualitative researchers ensure data analysis procedures are transparent and robust?
Qualitative researchers employ several strategies to ensure that their data analysis procedures are transparent and robust. Transparency and rigor are crucial in qualitative research to enhance the credibility and trustworthiness of the findings. Here are some common practices:
- Documentation of procedures: Researchers should provide a detailed and clear description of the steps taken during the data analysis. This documentation includes how data were collected, transcribed, coded and analyzed. Clearly document all steps of the data analysis process. Maintain an audit trail that outlines decisions made during the analysis, such as coding choices, interpretations, and changes made during the process.
- Peer debriefing: Engage in peer review or involve colleagues in the analysis process. This external input can help identify biases, enhance the credibility of interpretations, and ensure that the analysis is comprehensive. Involve yourself in discussions with peers or colleagues who are knowledgeable in qualitative research. Share your analytical process, findings, and interpretations to receive feedback and ensure a more rigorous analysis.
- Member checking: Share preliminary findings or interpretations with participants to verify their accuracy. Validate findings with participants to ensure accuracy and resonance with their experiences. Member checking involves going back to participants with the results and interpretations to confirm that they align with their perspectives. This process can help ensure that the researchers’ interpretations align with participants’ perspectives.
- Triangulation: Use multiple sources of data or methods (data triangulation) and involve multiple researchers (researcher triangulation) to validate the findings. This approach helps ensure that the conclusions are robust and not influenced by a single perspective. Triangulation enhances the credibility and reliability of the analysis by cross-verifying information from different perspectives.
- Researcher reflexivity: Researchers should be reflexive about their own preconceptions. Acknowledge and document your preconceptions and assumptions. This reflexivity helps in understanding how these factors may have influenced the analysis. Maintain a record of personal insights, challenges, and evolving thoughts throughout the research process. Reflecting on personal assumptions and perspectives can enhance the credibility of the analysis.
- Prolonged engagement: Spend sufficient time in the field to develop a deep understanding of the context. Prolonged engagement allows researchers to gather rich data and develop more nuanced interpretations.
- Thick descriptions: Provide rich and detailed descriptions of the research context, participants, and findings. This helps readers and other researchers understand the study’s context and enhances the transferability of the findings.
Ensuring transparency and robustness in qualitative research data analysis is crucial for maintaining the credibility and trustworthiness of the findings. By incorporating these practices, qualitative researchers can enhance the transparency and robustness of their data analysis procedures, thereby contributing to the credibility and trustworthiness of their research.
What are the key points to keep in mind while analyzing qualitative data?
Analyzing qualitative data can be rich and rewarding, but it also requires a unique approach compared to quantitative methods. Here are some key points to keep in mind as you embark on this journey:
- Embrace subjectivity:
- Recognize that your own experience and biases will influence your analysis. Be transparent about your positionality and strive for reflexivity throughout the process.
- Acknowledge the subjectivity of your participants’ data as well. Their individual perspectives and stories are central to your findings.
- Analyzing it helps you understand your participant’s mindset and behavior, which ultimately helps you develop a better understanding of the data.
- Focus on process, not numbers:
- Qualitative data analysis is less about generalizing to larger populations and more about understanding the nuances of individual experiences.
- Qualitative data analysis cannot be counted or measured because it describes the data. It refers to the words or labels used to describe certain characteristics or traits. This provides answers to the “why” or “how” behind the data analysis.
- Look for patterns, themes, and connections within your data, rather than seeking to quantify or statistically analyze it.
- Be inductive and flexible:
- Allow your research questions to evolve as you analyze the data. Be open to new insights and emerging themes that your data might surprise you with.
- Avoid forcing data into preconceived categories or trying to fit it into rigid research frameworks.
- Prioritize rigor and transparency:
- Ensure your analysis is systematic, documented, and well-reasoned. Keep detailed notes, track your coding decisions, and justify your interpretations.
- Consider using intercoder reliability techniques and member checking to enhance the validity and trustworthiness of your findings.
- Tell a compelling story:
- Qualitative data analysis is about making sense of complex human experiences and sharing them with your audience.
- It is based on interpretative philosophy, where you analyze data to tell a coherent story by connecting and establishing a relationship between data points based on themes and trends. The data here is typically text-based, descriptive, and unstructured.
- Use effective language, vivid examples, and evocative quotes to present your findings in a clear and engaging way.
- Additional points:
- Take your time and immerse yourself in the data. Read and re-read it to deepen your understanding.
- Utilize qualitative data analysis software to manage and organize your data effectively.
- Collaborate with other researchers and seek feedback on your analysis to gain different perspectives.
- Stay up-to-date with current qualitative research methodologies and best practices.
- There is no exact replication. Each study is unique. There are no absolute rules for it but guidelines for analysis. A lot depends on the skills of the researcher at each stage of study.
- Context is critical (i.e. physical, historical, social, political, organizational, individual context Dependence/interdependence).
Conclusion:
Qualitative data analysis is a flexible and dynamic process, allowing researchers to explore and uncover intricate details in a way that quantitative methods may not capture. It emphasizes the importance of context, participant perspectives, and the researcher’s reflexivity in shaping the understanding of the studied phenomenon. It is an iterative process. It is important for you to embrace the complexity and refine your approach as you progress. By keeping these key points in mind, you can navigate this journey with confidence and uncover the rich insights hidden within your data.
Reference:
Noble, H., & Smith, J. (2014). Qualitative data analysis: a practical example. Evidence-Based Nursing, 17(1), 2-3.